By Annie Maroon/DFP Staff
Separating a goalie’s performance from his team’s performance is difficult. After all, he can’t stop a shot, or let one past, unless it gets through five other players first. The topic comes up often on our live blogs, and in discussions about hockey in general: how much to credit a goalie in a win or blame him for a loss.
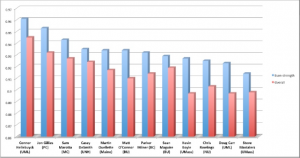
With those questions in mind, I took a look at a few less conventional goaltending stats for all the Hockey East goalies who have played at least 40 percent of their team’s minutes.* I looked at even-strength save percentage, quality starts (which are based on the same principle as quality starts for pitchers), and average shots against per game.
The idea behind evaluating goaltenders by even-strength save percentage isn’t that goalies shouldn’t be held responsible for power-play goals against, but rather that being a man down makes the other team more likely to score than they are at even strength. Especially on oft-penalized teams, goals outside of even strength can have a significant effect on save percentage, so even-strength save percentage is seen as a more reliable indicator of the way a goalie has played.
(Click to see the full-sized, interactive version.)
A few observations: First, if I learned nothing else from this project, I found even more proof that Jon Gillies has been Hockey East’s best goalie this year. At even strength, he allows goals on less than five percent of the shots he sees. UML’s Connor Hellebuyck technically leads him now, and a .961 mark is surely impressive, but Hellebuyck has made 16 starts to Gillies’ 31. As we’ll see, Gillies also faces significantly more shots per game.
Interestingly, BU’s Sean Maguire has the smallest gap between his overall save percentage and his even-strength one, which could reflect that he’s played better than average in special teams situations.
Quality starts have the same idea for goalies as for pitchers, but the method of calculating them is slightly more complicated. In the original Hockey Prospectus article, the parameters for a QS were laid out as follows: the goalie either records a .912 save percentage in the game, or he records a save percentage of .885 or better while allowing fewer than three goals.
I adjusted that slightly, changing the then-NHL league average save percentage of .912 to the Hockey East average, .910. Due to the small sample size, this is by no means perfect, but at the NHL level, a good goalie gives his team a quality start about 55 percent of the time, and the most reliable do it about 60 percent of the time.
Again, Gillies and Hellebuyck come out on top with the greatest percentage of quality starts. QS’s serve as a decent substitute for wins in evaluating goalies, and the gap between a goalie’s quality starts and his wins can start to separate his play from that of his team.
For instance, Gillies has 22 quality starts and only 15 wins, and Maine’s Martin Ouellette has just nine wins in his 16 quality starts. On the flip side, Boston College has found a way to win even when Parker Milner doesn’t keep them in it – he’s made 17 quality starts but gotten 20 wins. Maguire and Matt O’Connor have made 11 and 10 quality starts, respectively, and gotten 10 and eight wins.
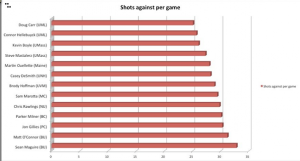
Finally, I looked at the number of shots each goalie sees on average per game, to add some context. Despite having the second-best shot-blocker in the nation, senior defenseman Sean Escobedo (and, until recently, then-top shot blocker Alexx Privitera), BU has let the most shots through to its goalies of any Hockey East team. Both Maguire and O’Connor have faced more shots on average than any of the other goalies, and Maguire has faced the most – 32.8 per game.
(Click through for the full-sized interactive version.)
It’s no surprise that Lowell’s two goalies, Doug Carr and Hellebuyck, saw the fewest shots per game behind the River Hawks’ stifling team defense. And, in accordance with the fact that they allow the most shots, BU has also given up the second-most goals in the conference, behind only Northeastern. Maguire and O’Connor are in the middle of the pack as far as save percentage, both overall and even-strength, but they’re being tested more frequently than any other starters.
None of these numbers give a comprehensive picture of these goalies’ value to their teams, but together, they show a few different sides of their performances. The evaluation is also incomplete without an understanding of the quality of shots each player has faced. If I can compile enough shot charts, maybe that’ll be an offseason project.
*Vermont’s Brody Hoffman is omitted from the even-strength save percentage chart only because Vermont’s website doesn’t keep track of power-play shots, so I couldn’t calculate it.


Recent Comments